
單細胞 ( Single Cell ) 定序技術的誕生,讓生醫研究進入新的維度。研究者能以「單一細胞」的程度來觀察數千-百萬顆細胞的獨特內容,後以大數據演算彙整眾多細胞的細微基因訊息,架構並定義出數位化生物調控模型,為許多舊問題提出更高維度的觀點,並提供新的探索方向。而單細胞加上新興三代定序技術,可望帶來生醫研究的另一波突破。
三代定序的特色是超長片段、單分子序列讀取,早期三代定序技術的正確性與可分析性不足,單細胞技術多以一般 NGS ( 二代定序 ) 搭配分析;隨著三代定序技術趨於成熟,長片段定序方法 ( Long-read sequencing ) 克服了一般 NGS 短片段定序 ( Short-read sequencing ) 的瓶頸,對於基因體大型結構變異 ( Large Structural Variation )、重複序列 ( Repeated Sequence )、複雜基因組合 ( recombination、splicing ) 等…可進行完整的序列分析。2022 年 Nature Biotechnology 期刊發表了「單細胞技術」結合「SureSelect V8」、「三代定序」的 single-nuclei isoform RNA sequencing ( SnISOr-Seq ) 方法,建立了一個能取得全長 cDNA ( Full-Length cDNA, FL-cDNA, 包含 UTR+CDS+polyA ) 表現內容,能通用於 PacBio、Nanopore 雙三代平台,並大幅提升 7.5 倍可用定序量的技術。該研究團隊利用 SnISOr-Seq 探討了腦神經系統單細胞 FL-cDNA 基因表現,藉著基因訊息試著解開人類大腦功能的分化及特定細胞類型的功能,研究成果如下:
1. 實驗方法大綱
兩個 30 mg 快速冷凍的新鮮正常腦部皮質 ( Cortex ) 抽出 nuclei 後,以 10X Single Cell 3ʹ GEM kit 進行初步文庫處理,處理後每顆 nuclei 會產生 有/無 具有 barcode 辨識序列的 cDNA library ( Fig 1a, 1b, 1c )。此時取出 30ng 的 cDNA library 進行 Linear/asymmetric PCR 步驟以放大帶有 barcode 辨識序列的 cDNA。後使用 SureSelect V8 抓取下 CDS 高佔比的 spliced cDNA 文庫 ( Fig 1d ),搭配 PacBio SMRTbell Express Template Prep Kit 或 Nanopore Ligation Sequencing Kit 完成文庫製備,並以對應的三代平台進行定序。研究團隊並基於不同三代平台數據特性,擬定平台最適化的序列去除錯誤、去除 artifacts、barcode 合併。獲得的高品質三代定序數據再與平行實驗的 illumina 二代數據比對確認一致度。並架構 exon 使用分類群模型,分析 FL-cDNA 內各 exon 的使用狀況。
 |
Fig 1: Overview of the SnISOr-Seq approach. a, Barcoded cDNA library of nuclei isolated from frozen human brain tissue. b, Three main types of molecules generated: spliced barcoded (known and novel isoforms), unspliced barcoded (exclusively intronic nucleotides) and incomplete cDNA without a cellular barcode. c, Linear/asymmetric PCR ('LAP') is used to selectively amplify barcoded cDNA. d, Probe-based exome capture ('CAP') step is applied to filter out purely intronic cDNA molecules. e, Molecules are sequenced on a long-read sequencer (PacBio and ONT). |
皮質包括神經元 ( Neuron )、星形膠質細胞 ( astrocytes )、寡突膠質細胞 ( oligodendrocytes )、小膠質細胞 ( microglia )、血管細胞 ( vascular cells ),首先使用兩個獨立樣品來源的健康額葉皮層組織 ( Cortex 1, Cortex 2 ),分別進行單細胞定序分析,得將之區分出 12 類皮質細胞類型 ( Fig 2a ),而神經元部分可細分出許多如:SST+、LAMP5+、PVALB+ 中間神經元 ( interneuron ),及 RORB+、SEMA3E+、LINC00507+ 興奮性神經元 ( excitatory neuron )。為評估 LAP-CAP ( Fig 1c, 1d ) 建庫處理是否助於定序表現,針對 LAP-CAP 處理前後的樣品進行三代定序 ( PacBio 及 ONT ),確認了經由 SnISOr-Seq 方法所得的目標訊號較一般 long read ISO-seq 結果高約 7.5 倍 ( Fig 2b ),也觀察到健康皮質樣本兩者之間基因表現的高相關性 ( Fig 2c ),確認了 SnISOr-Seq 系統的高再現性。
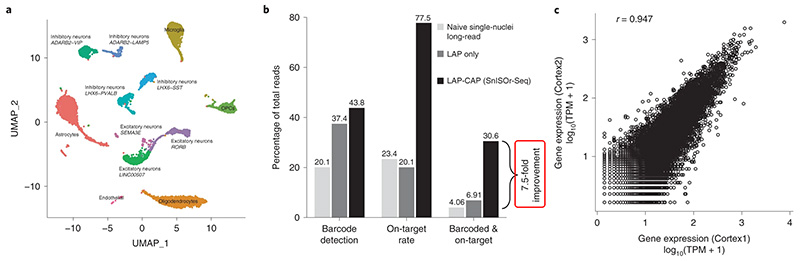 |
| Fig. 2: Cell type clustering and enrichment efficiency. a, UMAP plot of the Cortex1 sample with each point representing a single nucleus and colors indicating cell type. b, Bar plot showing the barcode detection rate, on-target rate and fraction of reads that are usable (that is, barcoded and on-target). Color of bars indicates experimental approach: naive single-nuclei long read (light gray) as a control; LAP (dark gray); SnISOr-Seq (black). c, Scatter plot of the correlation in PacBio long-read gene expression (log10 TPM + 1) between Cortex1 and Cortex2. Pearson correlation (r) is indicated. |
 |
| Fig 3: Alternative usage of single exons. a, Schematic illustrating percent spliced-in (Ψ) calculation for an alternative exon (green). The exon shows different levels of inclusion across three cell types, with variability defined as maxΨ − minΨ. b, Density plot of the exon variability across the four major cell types and exon length on the x axis. Colors indicate the discrete categories of variability. c, Box plots of the exon variability for alternative disease-associated exons (red) compared to alternative exons with no known association with that disease (green). P values obtained from a two-sided Wilcoxon rank-sum test. Investigated diseases are represented on the x axis (n = 46; 1,580; 69; 1,557; 227; and 1,399 exons). d, Full-length transcript expression by cell type for the CADM1 gene. Each horizontal line indicates one transcript, colored by cell type; clustered blocks denote exons. Black denotes annotated GENCODE transcripts. Purple boxes highlight three alternative exons: AE1–AE3. For box plots: center line, median; box limits, upper and lower quartiles; and whiskers, 1.5× interquartile range. |
 |
Fig. 4: Coordination of adjacent and distant exon pairs. a, Schematic showing types of exon coordination patterns when considering two alternative exons (red). Mutual inclusion (top) and mutual exclusion (bottom) of distant and adjacent alternative exons. e, Box plots of the |log-odds ratio| for significant genes on the y axis plotted against adjacent (n = 236) and distant (n = 25) exon pairs seen in b and c on the x axis. i, Scatter plot of the |log-odds ratio| of coordination for exon pairs tested for association versus the minimum primate PhastCons score from the exon pair. j, Scatter plot of the ΔΠ versus the minimum PhastCons score among the TSSs (left) and polyA sites (right) associated with an exon. Regression lines (i, j) with 95% confidence interval obtained using the loess fit. P values (e, g, h) obtained from two-sided Wilcoxon rank-sum test. P values (i, j) from two-sided Pearson's product moment correlation statistic. Significance: *P < 0.05; **P < 0.005; ***P < 0.001; NS, not significant. For box plots: center line, median; box limits, upper and lower quartiles; and whiskers, 1.5× interquartile range. VLMC, vascular lepotomeningeal cell. |
 |
| Fig 5: Exon coordination patterns are observable across multiple cell types. c, Bar plots of percentage of genes that are not testable in any cell type because at least one exon became constitutive. x axis values indicate adjacent (n = 114) or distant (n = 23). d, Bar plots of percentage of genes that are not testable in specific cell types because at least one exon became constitutive, colored by adjacent (n = 31, 31, 26, 26 and 22) or distant (n = 15, 15, 15, 15 and 14) exon pairs. e, Bar plot showing percent of distant coordinated exon pairs split by ASD association (n = 67 and 241). P value obtained from two-sided Fisher's exact test. b–e, Error bars indicate s.e. of the point estimate. f, Distantly coordinated exons for the PTK2 gene. Each horizontal line indicates one transcript, colored by cell type; clustered blocks indicate exons. Gray denotes annotated GENCODE transcripts. Blue boxes highlight coordinated exons, labeled Alt. exon 1 and Alt. exon 2. Control exon for qRT–PCR highlighted in blue. |
5. 神經細胞的外顯子-TSS、外顯子-polyA 間配對協同性
 |
Fig. 6: Exon–end site coordination is mediated by individual cell types. c, Heat map showing cell types as columns and exon–TSS pairs as rows (n = 66). Each element of the heat map is colored by whether the exon–TSS pair showed significant coordination (pink), was not significant (white) or was not testable because of low counts (gray) or because an exon or TSS became constitutively included in a cell type (teal). f, Heat map showing cell types as columns and testable exon–polyA sites as rows (n = 80). Each element of the heat map is colored as in c. g, Full-length transcript expression broken down by cell type for the BOD1L1 gene. Each horizontal line is one transcript; clustered blocks indicate exons. Gray denotes annotated GENCODE transcripts. Purple boxes highlight region of interest. Astro, astrocyte; EN, excitatory neuron; IN, inhibitory neuron; Oligo, oligodendrocyte. |
【參考資料】
留言
張貼留言